
In June, we reported our preliminary in-plant bench-marking results at the IPMA (In-Plant Printing and Mailing Association) show. At Graph Expo, we announced our latest bench-marking results in the presentation, “Only the Best In-Plants Will Survive – The Secrets of Leading In-Plants.”
The preliminary results indicated the following list of traits of in-plant leaders:
- 40% are responsible for their organizations’ MFD fleets;
- 80% are insourcing print work;
- 90% have purchased variable data printing software;
- 60% have color management software;
- 80% use estimating software.
The problem however was that, with only 44 qualified responses, we needed to enlist more participants to feel that the results were indicative of the overall population. It’s even more important to have a large enough response rate when you try to split the research into leaders and laggards and when you try to identify trends within specific types of companies or verticals.
Fortunately, the IPMA audience was very interested in the results and IPMA and In-Plant Graphics Magazine helped solicit additional candidates. As a result, the updated research is based on 111 respondents compiled of 31 leaders and 80 laggards.
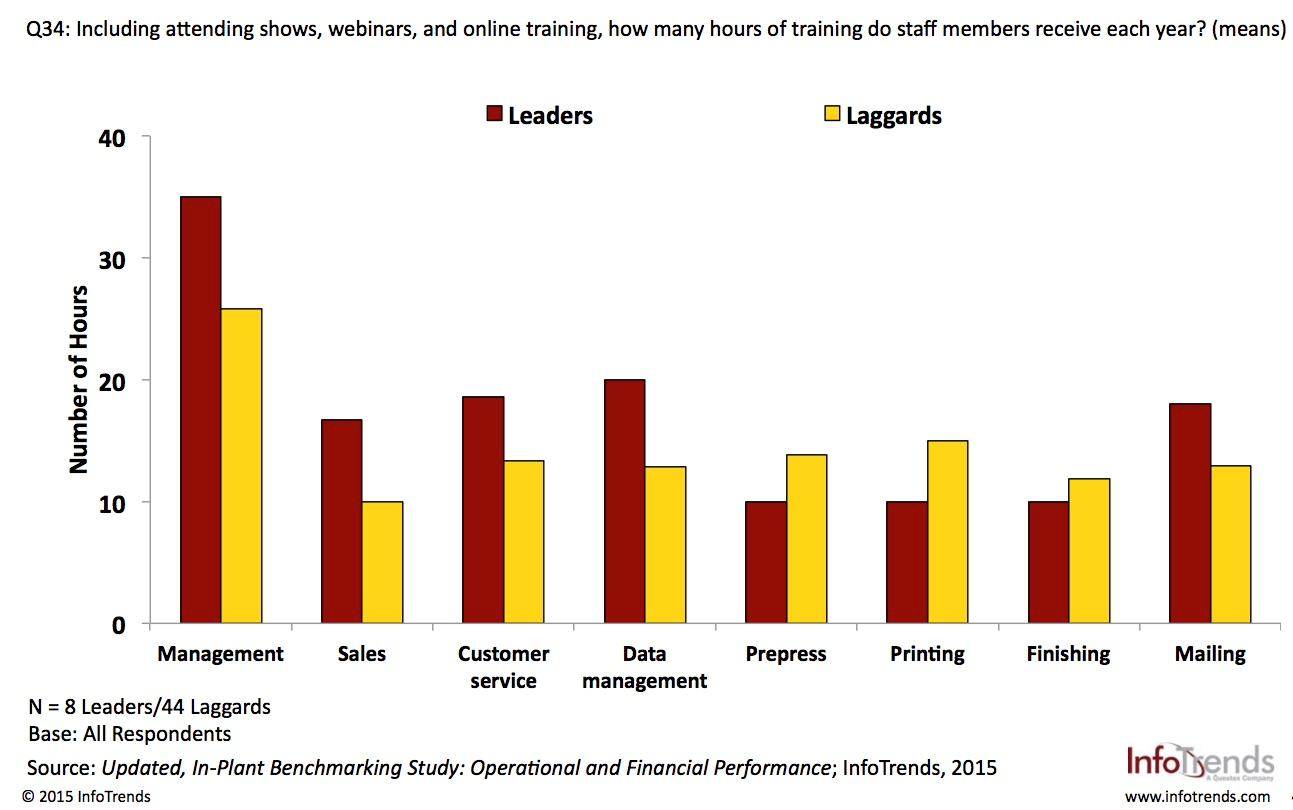
We now have enough responses to start breaking the results into specific in-plant vertical markets such as: education, government, and transactional in-plant printers. For example, when we looked at the educational in-plant marketplace, we found that leaders invested more time in training staff in management, sales, customer service, data management, and mailing services.
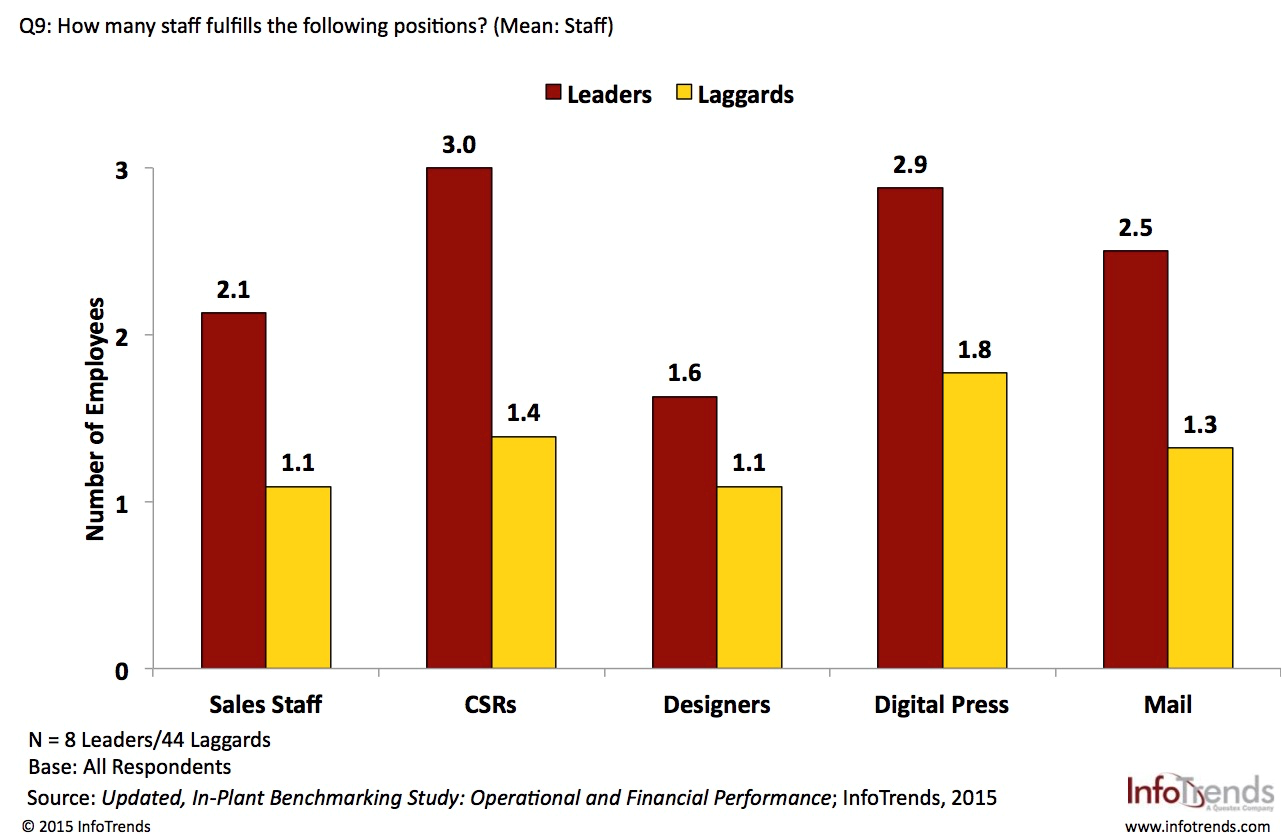
Also interesting about educational in-plant printers was that they tended to have more sales staff, customer service staff, designers, digital press operators, and mailing staff.
Of course, my first thought when looking at this data was to attribute differences to size. If, for example, the companies identified as leaders were significantly larger, you would expect that they would have more staff and require more training. However, the average sales of the leaders versus the laggards, although higher, were not significantly higher. The average sales for the leading in-plants was $2.5 million as opposed to $1.95 million for the laggards.
If you are an in-plant, you might want to ask yourself how you compare to the leaders. How much do you invest in training and how well are you staffed?


Comments are closed.